Sizing Kubernetes Solution
- justin antony
- Jun 13, 2024
- 9 min read

A Kubernetes cluster is a cluster of nodes configured in a master/slave architecture that runs containerized applications. And these cluster is made up of one master node and several worker nodes.
As mentioned above Kubernetes cluster consists of a set of worker machines, called nodes, that run containerized applications. Its obvious that every cluster has at least one worker node. The worker node(s) host the Pods that are the components of the application workload. The worker nodes are responsible for running the containers and doing any work assigned to them by the master node
The master node makes up the control plane of a cluster and is responsible for scheduling tasks and monitoring the state of the cluster. The control plane manages the worker nodes and the Pods in the cluster. In production environments, the control plane usually runs across multiple computers and a cluster usually runs multiple nodes, providing fault-tolerance and high availability.

Kubernetes v1.29 supports clusters with up to 5,000 nodes. More specifically, Kubernetes is designed to accommodate configurations that meet all of the following criteria:
No more than 110 pods per node
No more than 5,000 nodes
No more than 150,000 total pods
No more than 300,000 total containers
How about maximum number of Pods in AKS, EKS & GKE ?
AKS
Pods are limited to 250 per node in AKS. That is - If you have 10 nodes, you can have up to 2500 Pods.
the reason behind 250 per node as Kubernetes default is 110 per node.
Azure allocates a subnet with 254 hosts for each node (i.e. /24).
Since IP addresses might be recycled when a Pod is deleted, Azure has 4 spare IP addresses that it can use while the IP is still in use.
For example, if four pods are Terminating, four new pods can be created on the same node (the total is 254 — 246 pods Running: 4 Terminating and 4 in the Creating state).
But you can't have 5 pods terminating and 5 creating. You need to understand these difference before opting cloud services.
EKS
If you are not using the AWS-CNI or using a version older than 1.9.0, the max is 110 pods.
For example, an m5.large can have up to 58 pods.
However, an m5.16xlarge can have up to 737 pods.
GKE
GKE nodes are limited to 110 Pods each. That is - If you have 10 nodes, you can have up to 1100 Pods.
Why does GKE allow only 110 pods per node?
GKE allocates a subnet with 254 hosts for each node (i.e. /24).
Since IP addresses might be recycled when a Pod is deleted, GKE has more than half of the IP addresses available while that happens.
In GKE, you can have 110 pods in Terminating and 110 in Creating simultaneously (a total of 220 IP addresses).
You can scale your cluster by adding or removing nodes. The way you do this depends on how your cluster is deployed.
How to do we size the Kubernetes infrastructure ? How many Master and Worker node we need to have ? What should be the size for those nodes ?
It purely depends on what platform you are going to use. If it is a datacenter, probably some of the physical servers ( latest or old generation) what is available in your datacenter or you can pick out 'n' of instances from Public cloud for its worker node.
Still whether we manage with fewer number of servers ( physical for on-prem and instance for cloud) with high end configuration or more number of servers with lesser configuration ? There are many factors which determine these. Lets see what would be the best possible approach.
Few considerations when we size the infrastructure
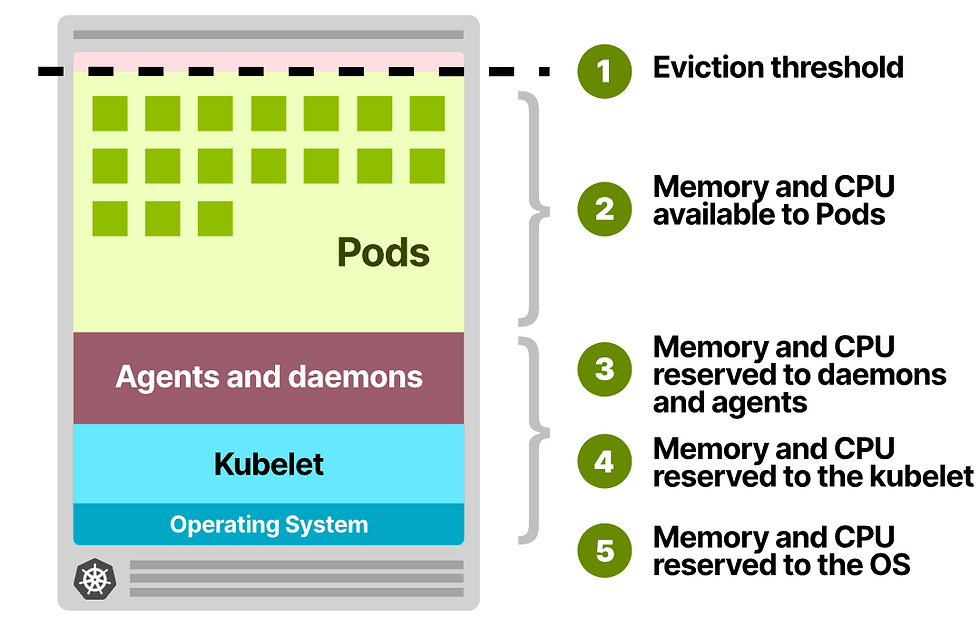
Not all CPU and memory in your Kubernetes nodes can be used to run Pods The node has to run processes such as the Kubelet, daemons such as Fluentd or kube-proxy, and the operating system.
Kubernetes also reserved memory for the eviction threshold to evict workloads when there isn't enough space left on the node
In similar way how we do overcommit for virtualization in Physical node, we do overcommitment for a node for running container/pod.
When you define your pods, you are encouraged to set requests and limits.
The Kubernetes scheduler assigns (or not) a Pod to a Node based on its memory and CPU requests.
The Kubelet uses the limits to terminate or throttle the Pod when it passes the threshold.
While you can assign the same value for requests and limits, having requests lower than the actual limits is common.
As a consequence, a process can grow its memory and CPU usage until it reaches the limit.
If the application occasionally burst into higher CPU or memory usage, that's fine.
But what happens when all Pods use all resources to their limits?
This scenario could lead to resources starvation.
When the memory and CPU usage outgrows the resources on the node, it leads to:
CPU throttling for the Pods and the processes on the node such as the kubelet.
The total memory usage on the node will pass the eviction threshold, and the kubelet will start evicting pods.
While this is designed to happen, it is something that you want to minimize to avoid disruptions.
You can ensure that limits and requests are always in check and the ratio between limits and requests is not too high.
There are two different types of resource configurations that can be set on each container of a pod.

They are requests and limits.
Requests define the minimum amount of resources that containers need. If you think that your app requires at least 256MB of memory to operate, this is the request value. The application can use more than 256MB, but Kubernetes guarantees a minimum of 256MB to the container.
Limits define the max amount of resources that the container can consume Your application might require at least 256MB of memory, but you might want to be sure that it doesn't consume more than 1GB of memory. That's your limit. Notice how your application has 256MB of memory guaranteed, but it can grow up until 1GB of memory. After that, it is stopped or throttled by Kubernetes
Assigning proper requests and limits for your workloads is essential to control overcommitment. So lets understand limit and request more in detail.
Setting limits is useful to stop over-committing resources and protect other deployments from resource starvation. You might want to prevent a single rogue app from using all resources available and leaving only breadcrumbs to the rest of the cluster.
Requests affect how the pods are scheduled in Kubernetes.
When a Pod is created, the scheduler finds the nodes which can accommodate the Pod.
The scheduler reads the requests for each container in your Pods, aggregates them and finds the best node that can fit that Pod. Some applications might use more memory than CPU. Others the opposite. It doesn't matter, Kubernetes checks the requests and finds the best Node for that Pod.
Understanding CPU and memory units
Imagine you have a computer with a single CPU and wish to run three containers in it.
You might want to assign a third of CPU each — or 33.33%.
In Kubernetes, the CPU is not assigned in percentages, but in thousands (also called millicores or millicpu).
If you wish to assign a third of a CPU, you should assign 333Mi (millicores) to your container.
Memory is a bit more straightforward, and it is measured in bytes.
Kubernetes accepts both SI notation (K,M,G,T,P,E) and Binary notation (Ki,Mi,Gi,Ti,Pi,Ei) for memory definition.
To limit memory at 256MB, you can assign 268.4M (SI notation) or 256Mi (Binary notation).
If you are confused on which notation to use, stick to the Binary notation as it is the one used widely to measure hardware.
Challenges:-
You have infinite loop, slow algorithms, or application, or even attacker got control of a single pod (container) or you need to restrict the impact of DDoS Attack
What solution you would be considering.
Solution - Resource Quotas
*DDoS Attack needs a specific solutions from Open Source tools, Cloud services, Paid Services from 3rd party organizations. It can be WAF ( Web Application Firewall) or Rate Limit at App Layer.
When you encounter DDoS attack increasing the deployment replicas to meet the requirements may not be right fit as number of POD increase from 5 to 10 and then to 25 or even 50. Increasing Pods can exhaust server resources, which can bring down the entire node/system and cluster. To limit the impact of this auto scale or replica, Kubernetes has "Resource Quotas" which allow scaling within controlled amounts.
If you have set a memory limit of 1 GB in pod spec. And a quota of 20 GB per namespace with "limits.memory" in ResourceQuota spec.
kind: ResourceQuota
metadata:
name: cpu-memory-quota
spec:
hard:
request.memory:"10Gi"
limits.memory: "20Gi"
In this case, maximum pods can't be beyond 20 (1GB limit/Pod.) This can prevent entire system failure..
Note:-
When your container size is small and the Pod loads fast.
averageUtilization can be between 75 to 85.
But.
When your container size is not small and the Pod loads slow.
averageUtilization can be between 65 to 75.
Your apps on Kubernetes stop working
They might have stop working because of below reasons.
Because of a glitch.
Or maybe it's stuck.
How do you handle this situation.
Solution - liveness probes
Liveness probes regularly asks your app/pod to do a simple work. If it can't, the probe know something's wrong. And so it gently restarts the affected Pod.
The new Pod means happy and healthy app
livenessProbe:
httpGet:
path: /health
port: 8080
initialDelaySeconds: 5
periodSeconds: 10
This needs to be configured correctly to get the benefits or else it may lead to disaster.
Don't use complex scripts. Let's say scripts that take 5 seconds to finish
Have some reasonable interval, such as 10-30 seconds. Set it based on your app's response times and health check requirements.
Choose the most appropriate probe type (HTTP, TCP, or Exec) for your application's health checks.
Monitoring: Track probe results and container restarts to fine-tune configuration and identify potential issues.
Kubernetes Stateful Set updates are slow
Solution - Because it supports one-pod-at-a-time rolling update hence we need to speed up the update by doing necessary changes in Stateful Set definition file.
In the StatefulSet definition file, under rollingUpdate, set - "maxUnavailable."
Assume that you set it to 2. Kubernetes will now update 2 Pods.
Instead of updating one at a time.
spec:
containers:
- image: registry-url/nginx-slim:0.8
name: nginx
updateStrategy:
rollingUpdate:
maxUnavailable: 2
partition: 0
type: RollingUpdate

Is it a good idea? To save cost by increasing maximum number of Pods running on a single node?
Solution - Kubernetes allows you to increase total number of pods that can run on a single node
The Default: 110 Pods/Node. By changing the "maxPods" config in Kubelet config and restart would bring new changes to the platform.
Is it recommended? Not at all for obvious reasons.
1. Increased overhead on kubelet.
2. Competition for resources (CPU, memory, & network).
3. Logging and monitoring (Volume of logs generated is high).
4.Performance Degradation
5.Application stability
When you choose to have more than 110 pods/node, kubelet can face many issues.
Before understanding all these, try to understand "PLEG"
PLEG stands for "Pod Lifecycle Event Generator". It is responsible for tracking pod events and keeping the cluster stable. This will "report back to Kubelet" about the state of Pods.
With more Pods in cluster, PLEG can experiences more lifecycle events. This can include (creation, deletion, restarts) that it needs to track. With heavy load, time out issues can creep in. Mainly because it can't track everything due to overload. This can mark the node as "NotReady" in the cluster. You will see errors like - "PLEG is not healthy."
How do you fix them?
1. Increase nodes in cluster.
2. Distribute the Pods across all nodes.
Kubernetes Gateway API.
It is a new way to manage traffic to Kubernetes services. 🤠
How is it different from Ingress?
Ingress focuses on routing HTTP traffic.
While Gateway API supports a wider range of protocols, including HTTP, TCP, and gRPC.
It also supports:
HTTP Routing & TCP Routing
HTTP Traffic Splitting (10% to service-1 and 90% to service-2)
Cross-Namespace Routing
Role-Based Access Control
Enhanced Secuirty Controls
Running Kubernetes in Cloud on On-prem
Running On-prem Kubernetes is tricky.
Because of 3 reasons:
1. Complexity at (Infra + Security) layer.
2. Restrictions with out-going internet access on Infra.
3. Less control over firewall & external load balancers.
Then why choose an on-premise setup?
Compliance. The customer needs it. In most cases, it's because they want full control over the data.
Things to understand
Different configuration options available for Kubernetes.
Different components and how they work together.
Different ways to deploy to Kubernetes.
Different ways to manage the clusters.
Certificate generation part. Where they reside.
Where manifest files sit.
Where are logs placed.
In Kubernetes, master nodes get regular updates about worker nodes status? Who updates the master? How Often ? Which configuration is responsible ?
It's the Kubelet, The default is 5 minutes. (The status is updated, even if there is no change.). And "nodeStatusReportFrequency" is the Kubelet config that controls it.. Now. Here's the important bit. If a node status is changed, kubelet will attempt to update master ASAP. This allows master to reschedule workloads accordingly and speeds up things.
Operation Tools
Are Prometheus and Grafana the best monitoring stack available for Kubernetes?
We are using OpenSearch and OpenSearch Dashboards for managing logs
Debugging Commands
While debugging: I want to stream pod logs based on a label.
k logs -l component=etcd -n kube-system -f
Sometimes I need timestamp too.
k logs -l component=etcd -n kube-system -f --timestamps
In summary.
"-l component=etcd" prints pod logs with label "component=etcd".
"--timestamps" to display time.
"-f" for streaming logs.


Comments